Resources
TOOLS


RREAL Sheet database
Examples of RREAL sheets (also known as RAP sheets) developed by RREAL and other teams


Internal team organisation across data collection and data analysis workstreams


Videos
Introduction to RREAL
Introduction to RREAL
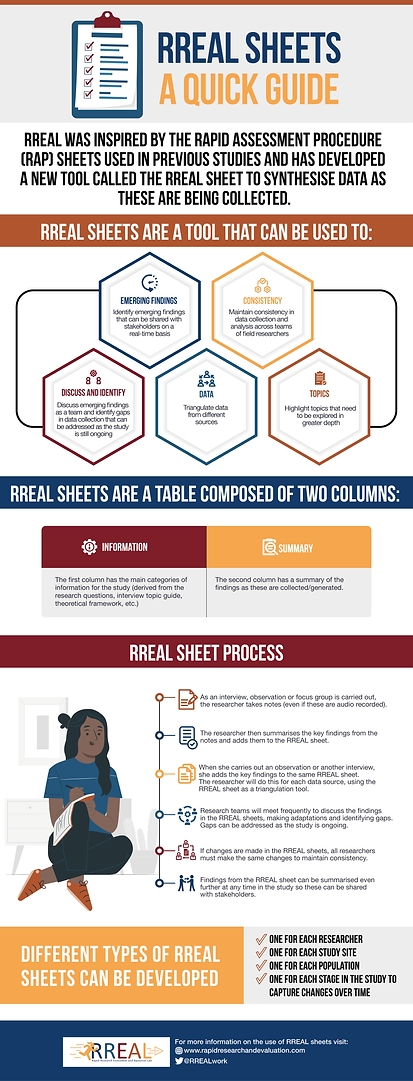
RREAL RAP Sheets
RREAL RAP Sheets (English)
RREAL Reasearch during the COVID-19 Pandemic
RREAL Research in a Global Network During the COVID-19 Pandemic
RREAL Research:
Healthcare Workers and COVID-19, Vaccination
RREAL RAP Sheets (Spanish)
RREAL Research:
COVID-19, Healthcare Workers and PPE
RREAL Research: COVID-19 and Surgical Services
Rapid Qualitative
Research
Listen to an interview with Dr Cecilia Vindrola, one of RREAL's Co-Directors, as she reflects on the benefits and challenges of rapid qualitative research, including a recent study on COVID-19.

Interactive RREAL Research Tracker
Utilise our RREAL Tracker to explore the themes, links and connections in the field of Rapid Research Evaluation and Big Qual Data methodologies.
Utilise our RREAL Tracker to explore the themes, links, and connections in the field of Rapid Research Evaluation and Big Qual Data methodologies. This tracker is directly linked to the Living Systematic Review from our research with RREAL’s LISTEN project, as presented in the paper “Making the most of big qualitative datasets: a living systematic review of analysis methods.” The paper highlights the challenges and opportunities presented by large qualitative datasets in research and provides innovative solutions for their analysis.
The interactive Infranodus network graph associated with this living systematic review visually represents the relationships between different analysis methods and concepts discussed in the paper. By exploring this graph, users can uncover insights into the interconnectedness of qualitative data analysis techniques and identify key themes shaping this evolving field.
Click the box below for instructions on how to explore this graph:
-
The network graph displays key themes (nodes) and their connections (edges). Larger nodes represent dominant topics, while thicker edges indicate stronger relationships between themes.
Hover over a node to see its connections and related terms.
-
Click on a node or connection to reveal the related text excerpts or statements on the left-hand panel. This provides contextual information about the selected themes.
-
Use the Main Topics section to explore the most relevant clusters. Clicking on a topic will highlight its nodes and connections in the graph.
Explore Most Influential Concepts to identify key ideas shaping the discussion.
Use filters like All Insights, Trends, or Sentiment to uncover deeper patterns and trends in the data.
-
Use the search bar at the top right to find specific terms or concepts. The graph will adjust dynamically to display relevant connections.
-
Toggle between different views (e.g., Advanced Mode or Visible Graph) to adjust the level of detail shown.
Use the modularity slider (bottom right corner of the graph) to adjust the topical diversity and see smaller, more focused clusters.
-
Access the Download Reports section on the right to export keywords, TXT reports, or CSV data for further analysis or record-keeping.
-
Use the AI Insights button to summarise the graph and generate high-level interpretations.
Click Reveal Underlying Ideas to explore hidden connections and blind spots.
-
Refer to the Help & Manual button on the right-hand panel for detailed guidance on graph functionalities.